Michael Marder
Professor of Physics, Executive Director of UTeach, The University of Texas at Austin.
Interviews on education and poverty at the Texas Tribune: http://tinyurl.com/MarderTT.

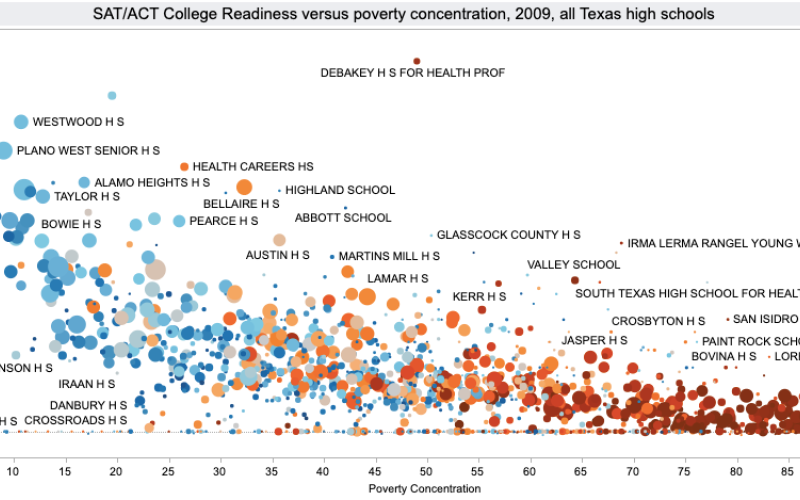
SAT/ACT College Readiness versus poverty concentration, 2009, all Texas high schools
Poverty Concentration is percentage of students eligible for free and reduced lunch. SAT product is percentage of graduates in 2009 who got 1110/1600 or more on the SAT or 24 or more on the ACT.

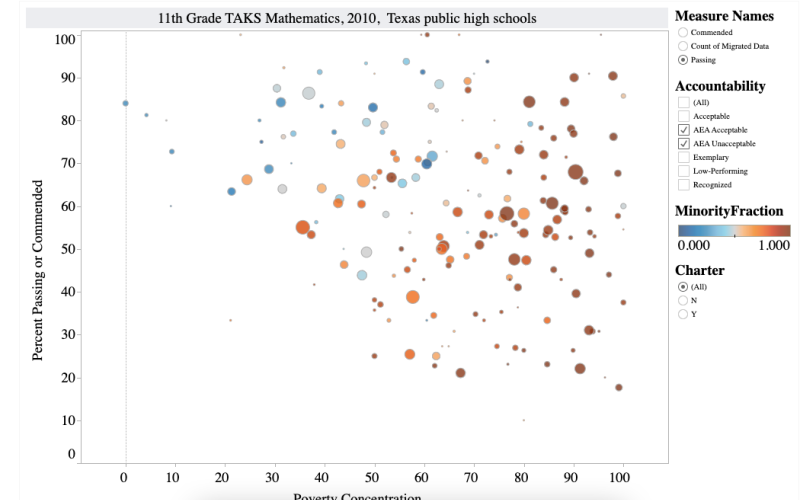
11th Grade TAKS Mathematics, 2010, Texas public high schools
Images of accountability status of Texas charter schools in 2009, Texas 11th Grade Mathematics.

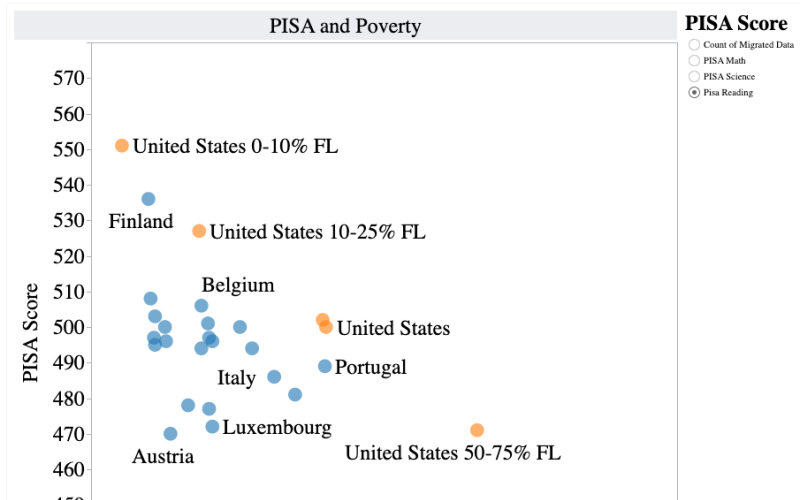
PISA and Poverty
Results from PISA 2009 disaggregating OECD countries and United States schools by the level of child poverty. Inspired by a blog posting of Mel Riddle, but with new data from UNICEF.

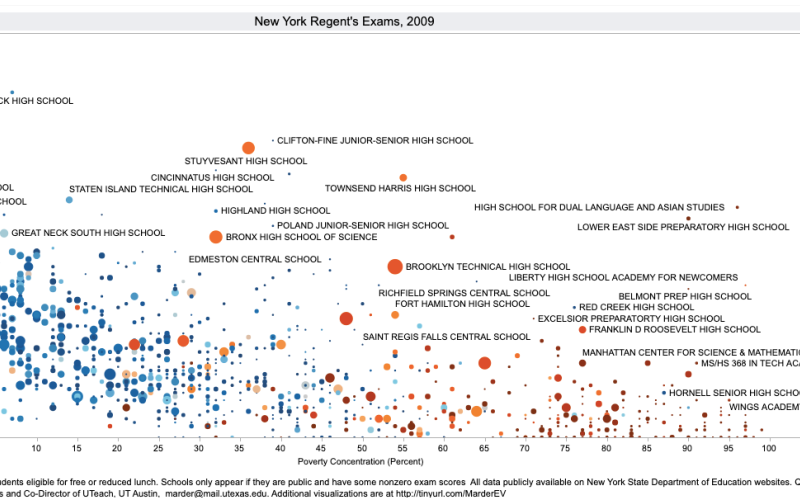
New York Regent's Exams, 2009
Poverty Concentration is fraction of students eligible for free or reduced lunch. Schools only appear if they are public and have some nonzero exam scores All data publicly available on New York State Department of Education websites.
The opinions expressed on this page are not necessarily shared by the UTeach program, The University of Texas at Austin, the Texas Education Agency, the Texas Higher Education Coordinating Board, the National Science Foundation, or the State of Texas.

